 ,
,  or
or  signs located at its top right
corner.
signs located at its top right
corner.•The Perytons™ Protocol Analyzer allows the user to open several windows.
Each window
may be closed by pressing the , or signs located at its top right
corner.

Figure 71 – Closing a window
Clicking on a window section title allows placing the window anywhere in the Perytons™ Protocol Analyzer Main window (location symbols will appear while the window is selected and dragged):

Figure 72 – Re-locating windows in the main layout
Dragging the window into one of the location symbols will place the dragged window adjacent to the relevant location in the section (e.g. dragging it to the up location symbol will place the window adjacent to the upper window border in and will have full width). Dragging the window into the center location symbol, will place it in the relevant section while achieving its full section size.
The resulting location of the dragged window will be shown in a shadow-like rectangle in order to ease re-location decision before releasing the window drag.
Double-clicking on a window section title will place it back to its original location in the layout.
To open currently non-visible windows use the 'Windows' text menu in the top menu:

Figure 73 – Main View, Windows Menu
•Default Layout 
Selecting Default Layout in
the window menu restores the original window factory settings, with Time View,
Network View, Message View, Message Tree/Devices View, Message Sequence View and
Statistics Charts windows displayed and the other windows
hidden.
Note: The user can define specific layouts that include the
windows he most frequently uses – see also 1.2.
•Message Sequence View (see additional explanation in chapter 7)
Displays a chart showing
the communication sequence between devices. The Message Sequence View can show
the interaction between two devices (in which case the various messages' top
layers involved can be displayed) and up to 8 devices on a single screen.
Specific Transactions (e.g. HTML or TCP streams, etc.) can be grouped –
collapsed or expanded – for easy recognition and investigation.
•Message Tree View (see additional explanation in chapter 5)
Shows messages in tree-view mode with color coded branches and sub-branches as well as detailed Hexadecimal/Binary data and with the deciphered data if relevant.
•Statistics Charts (see additional explanation in chapter 15)
Show captured data summary in easy to read statistical charts.
•Bookmarks and Notes (see additional explanation in chapter 8)
Allows managing Time View bookmarks as well as Messages and Devices notes through the Bookmarks and Notes window.
•Devices View (see additional explanation in chapter 9)
Show a table view of the devices in the network with all information collected by the analyzer for each device.
•Legend (see additional explanation in paragraphs 3.13, 6.4 and 9.2)
Show the Time View and
Network View objects shape, size and default color codes.
Note:
Some of these properties can be altered by the user within the Preferences tool
(or by implementing a relevant Script). Updates will be shown in the Legend
window only after restarting the Perytons™ Protocol Analyzer.
•Time View (see additional explanation in chapter 3)
Show messages along the time axis. For each message basic information is displayed in a hint (tooltip).
•Events Log
Show the Events and Alarms Window. The user can write events and alarms to the Events Log with the Peryton-SDK Add-On and from Scripts (written using the Peryton-Scripting Add-On). An 'envelope' like icon will appear on the lower right corner of the Main Window indicating that there are new messages in the Events Log. Pressing this icon also opens the Events Log window.
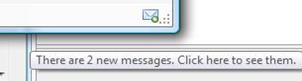
Figure 74 – New Events Log messages notification
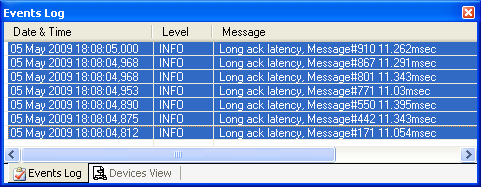
Figure 75 – Example result of an Events Log created by a Script
•Network View (see additional explanation in chapter 6)
Show the network topology
including devices, connections and routes.
A floor plan, map or other picture
of choice can be used as a background of the Network View window and devices can
be relocated over it by the user.
•Message View (see additional explanation in chapter 4)
The Message View window allows seeing the content (values or meaning) of selected messages in graphical or tabular format. It has a main tab, message compare tab (optional) and search results tabs (optional).