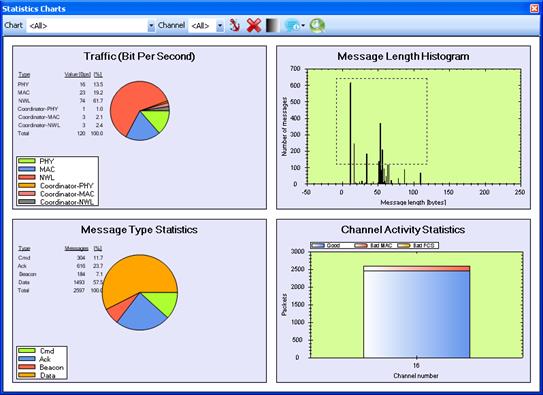

The Statistics Charts window displays general information of the captured data in easy to read charts. When marking the Statistics Charts window in the windows list or by clicking on the Statistics icon in the Main window, the Statistics Charts windows opens. In addition to the charts shown in this chapter that are included in the Perytons™ Protocol Analyzer license as default, the use of Scripts allows the user to define customized statistics charts that will be added to the Statistics Charts window. See chapter V.2 for details on using the Peryton-Scripting Add-On to write and modify Scripts.
In Real Time capture the charts get updated while new data is being captured.

Figure 246 – Statistics Charts window
Double-clicking on any of the charts will bring the chart to full size in the Statistics Charts window section. Double-clicking on it again, will bring all defined charts into the Statistics Charts window.