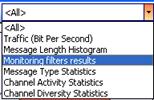
Figure 249 – Statistics Charts, User choices
The required chart can be chosen from the drop-down list in the 'Chart' choice list, or by double clicking on the desired chart
Note: Only non empty charts are displayed. If for example the data was captured with no diversity information, the diversity chart will not be displayed.
The required channel can be chosen from the drop-down list in the 'Channel' choice list.
The <All> is used to display accumulative information collected from all channels.