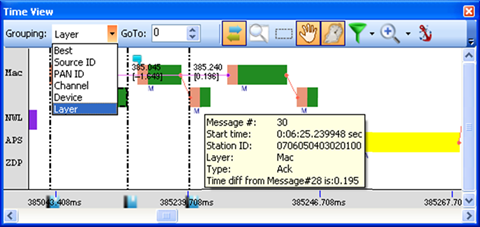


Figure 94 – Time View window
The Time View window shows the received messages over time (horizontal axis). The vertical axis is used to group messages according to different parameters such as Source ID, PAN ID, Channel, Device number (set by the analyzer), user defined Name, message highest protocol Layer, message Type and IP Address or IP Address/Port (if relevant), or just one message after the other while time lapses between them is suppressed from view (Best). For each message, the message structure (preamble and body) is shown in a color coded format and additional basic message information (e.g. message number, time stamp, station ID, Layer, type, time-difference from the first selected message in Time View and message user note) appears in a tooltip form when hovering over a message with the mouse. For detailed study of messages it is recommended to select and drag (copy) them into the Message View window.
Related messages (e.g. a message and its acknowledgement) are connected with lines (links). When hoverin over these lines with the mouse, a tooltip including data related to the connection (e.g. latency, etc.) appears:

Dragging a captured data file (.ANL, .DCF or .PCAP) or workspace file (.WRK) from a Windows Explorer window and dropping it in the Time View window of the analyzer opens the file.