
Each message is composed of different sections, each described by a distinctive block drawing:
Figure 132 – The message structure in Message View – Graphical Mode
Notes:
Message section colors and other properties can be changed from their default by using User Preferences and/or relevant Scripts. See details about these options in par. 19.4 and chapter V.2 respectively.
Additional/different sections and blocks may appear based on the message nature and the protocol/profile set for analysis.
•Msg (Message number)
Given to the message by the analyzer during data capture. This section is always shown and can’t be expanded. The color of the Msg field indicates the message status (default is green for OK, yellow for WARNING, and red for ERROR). Msg color and name can be set by using the User Preferences tool and changed via Scripts. This allows the user to easily distinguish and refer to different messages
•Info
Summarizes general information about the message captured by the analyzer (message number, start time, length, channel, RSSI, etc.)
•Dev (Device)
Summarizes the currently information known by the analyzer about this device. It also shows conflicts related to previous messages sent by this device, or additional information collected. This section will only be present for messages with source address information, or for those were the information was deduced by the analyzer (e.g. identifying an ack source by finding the source message that this ack is acknowledging and retrieving the address from it)
•MAC – shows the message MAC information
•NWL – shows the message's ZigBee Network Layer fields
•APS
Shows the message's ZigBee Application Support Layer fields
•ZDP – shows the message's ZigBee Device Profile
•Profile - Shows the ZigBee Profile (and ZCL commands) layer
•Payload – shows the message payload information that could not be asignated to any known protocol layer, etc.

Figure 133 – The Message structure
Notes:
Sections that are
deduced by the analyzer based on data not necessarily included in a specific
message (e.g. based on data received by other devices, based on an existing
device .ANV file, etc.), usually summarize relevant information and are marked
with a small white triangle in the top right hand side of the field block - a
relevant note is included in the tooltip that appears when hovering over them
with the mouse - i.e. '(This field was deduced by the analyzer based on the
received data)'.
Any of the sections
(besides Msg) can be hidden from view by unmarking them in the Show/Hide Fields
(toggle) sections selection icon ( ). See more info in
par.4.1.
). See more info in
par.4.1.
Each section is composed of one field or several fields.
Each field has a title line, a content/value line and a tooltip (the tooltip shows when the mouse is placed over the field):

Figure 134 – Message field title line, content/value and hint
Some fields may have
sub-fields or 'sons' (for example a beacon field contains beacon parameters
field sons). When having 'sons', the relevant field block is marked with a small
+ (plus) sign in their top left hand side. Expanding or collapsing (toggle) of
field sons is done by double-clinking anywhere on the parent field block. Fields
already expanded are marked with a small – (minus) sign in the top left hand
side of the field block. All fields of a selected message can be expanded or
collapsed by pressing the expand all/collapse all icons ( /
/ ), or using the expand/collapse option in the
Message View menu accordingly.
), or using the expand/collapse option in the
Message View menu accordingly.
Unlike non-related fields, all related fields (parents and their sons) are shown within a continuous block structure (i.e. no space between blocks) even if in expanded mode.
A list of all applicable fields and their values can be exported to a Schema XML file (XSD). See more info in chapter 17.

Figure 135 – Message with expanded fields
Each protocol section (e.g. MAC) hex data displayed in the data list field has a background color similar to the relevant MAC subfield (e.g. Header, Command, FCS).
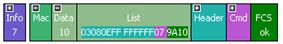
Figure 136 – Message background colors
The content/value line shown under the field/block name varies according to the field meaning and context. Description of the value is shown in the field tooltip that appears when pointing to the field with the mouse. The following example shows that the Data field contains 12 (decimal) bytes which are shown in the List (Data subfield) in hexadecimal format:

Figure 137 – Message content/value line
Bit fields that share the same byte/word will have the same color, while other fields may have slightly different color shades.

Figure 138 – Message colors shading