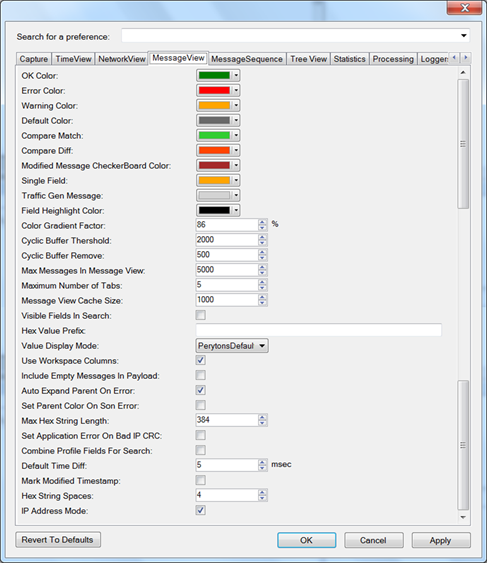
Setting Message View related parameters:

Figure 292 – Preferences, Message View tab
•OK Color:
Sets the color of fields when in good status (e.g. FCS or Message Status = 'OK').
•Error Color:
Sets the color of fields when in error status (e.g. bad FCS or bad Message Status).
•Warning Color:
Sets the color of fields with a warning (e.g. a field that has an illegal value).
•Default Color:
Sets the color of fields with no special color specified.
•Compare Match:
Sets the color of fields in the Compare Results tab that had the same value in both compared messages.
•Compare Diff:
Sets the color of fields in the Compare Results tab that had different values in both compared messages.
•Modified Message CheckerBoard Color: - valid only when the Peryton-TG Add-On is installed
Sets the color of messages modified by the user.
•Single Field:
Sets the color of fields in the Compare Result tab that only existed in one of the compared messages.
•Traffic Gen Message: - valid only when the Peryton-TG Add-On is installed
Sets the color of fields transmitted (and received) by the Peryton-TG Add-On.
•Field Highlight Color:
The border color of a field that contains the searched value (for the Search Results tab).
•Color Gradient Factor:
A color gradient is used to distinguish between fields that share the same byte/word.
In the following example the header section contains several fields. The fields between FType and SMode are bit fields of the same word, while the other fields are byte/word each. Therefore they have a different flavor of turquoise.

Figure 293 – Message with Color Gradient of 90%
Changing the gradient from 90% to 80% will emphasize the fields as follows:

Figure 294 – Message with Color Gradient of 80%
•Cyclic Buffer Threshold:
In Real-Time capture mode, if
messages are moved to the Message View window automatically (either by a Script,
or by using the automatic copy to Message View icon  ), the
number of messages in each Message View tab can’t exceed this threshold. When it
does, the number of messages defined in ‘Cyclic Buffer Remove’ (see next) is
removed from the Message View Main tab.
Note: If using a 'strong' computer (fast processor and large RAM) this value can be set to 10,000 messages or more. In 'weaker' computers it is recommended keeping this value below 2000.
•Cyclic Buffer Remove:
In Real Time capture mode, this is the number of messages that will be removed from the Message View Main tab each time the number of messages exceeds the value set in the ‘Cyclic Buffer Threshold’ (see above).
If this value is set to zero, the number of messages in the Message View Main tab will be kept equal to the ‘Cyclic Buffer Threshold’ (so when several new messages are added, the same number of old messages are removed).
Note: In Continuous data capture mode, messages that are removed from Time View due to Time View buffer settings can be still kept in one (or more) of the Message View tabs (e.g. search results). In this case when looking to find the message in other views, it will not be located in Time View because it was already removed from Time View window.
•Max Messages In Message View:
When opening an existing capture file (not in Real-Time or Simulation modes) this value sets the limit of messages that can be displayed in any Message View tab.
Note: If using a 'strong' computer (fast processor and large RAM) this value can be set to 20,000 messages or more. In 'weaker' computers, it is recommended keeping this value below 5000.
•Maximum Number of Tabs:
Maximal number of Message View tabs allowed. This practically limits the number of search results that can be displayed.
Note: If using a 'strong' computer (fast processor and large RAM) this value can be set to 15 tabs or more. In 'weaker' computers it is recommended keeping this value below 8.
•Message View Cache Size:
Number of messages that will be kept in the Message View cache. This allows tradeoffs between memory requirements and processing performance.
Note: If RAM size is 2Gbyte or more, this number can be set to 20,000. Otherwise it is recommended keeping this value between 1000 and 5000.
•Visible Fields In Search:
If checked, searches can be only made in visible fields (visibility can be set by a Script – see paragraph V.2.9). Otherwise search can be made in all fields regardless of their visibility state.
Note: When using Scripts to change the visibility of fields, mark this box so only fields made visible by the Script will be shown in the available fields' selection box.
•Hex Value Prefix:
The user can add a text (e.g. ‘x’) that will be added as prefix to Message View values to indicate that the value is displayed in Hexadecimal format.
•Value Display Mode: – Hex, Decimal, PerytonsDefault
By default, the analyzer displays some values in hexadecimal and some as decimal. Usually device addresses, keys, network ID and Cluster IDs are displayed in hexadecimal format while other values are displayed as decimals. The tool-tip that appears when placing the mouse over the field/value, usually indicates the display mode used.
With the Value Display mode the user can choose to display all numeric values as hex, decimal, or as a context based mixture (according to the defaults set by Perytons).
Notes: When choosing
Decimal, values longer than 8 bytes, will be still shown in hexadecimal
format.
The decimal/hex indication will become active only after opening a
new capture file.
•Use Workspace Columns:
When checked, the table view columns will be taken from the workspace environment rather than using the list of columns defined by the user.
•Include Empty Messages In Payload:
When marked this box will make the analyzer include all messages when exporting Payload to file. Messages with no payload will have zero length. See chapter 17).
•Auto Expand Parent On Error:
If checked, the parent field will be automatically expanded if any of its subfields has an error or warning (either protocol error or application error).
•Set Parent Color On Son Error:
If checked, the parent field error/warning color will be set by the most severe error/warning status of any of its subfields.
•Max Hex String Length:
Sets the maximal number of bytes allowed in a single string (in hexadecimal format).
•Set Application Error On Bad IP CRC:
If checked, when an IP message with bad IP CRC is captured, it will be marked to show an application error (see paragraph 4.3.9).
•Combine Profile Fields For Search:
Typically each ZigBee profile has its own set of commands and attributes. When this preference option is checked, all profile attributes, commands and additional similar fields, will be combined into a single set of search fields
•Automatic Green Power Detection: (available only when using the ZigBeeProtocol plugin)
If checked, the analyzer will automatically detect Green Power messages when any ZigBee profile is chosen as an ‘Active Protocol’. The detection is based on MAC fields' content.
This allows the analyzer to analyze a ZigBee Profile as well as Green Power messages (which have different NWL structure) simultaneously.
•Default Time Diff: - valid only when the Peryton-TG Add-On is installed
Defines the time difference to set between new messages manually added to an .ANL file
•Mark Modified Timestamp: - valid only when the Peryton-TG Add-On is installed
If checked, the analyzer will mark the timestamp field on messages where the field has been manually modified
•Hex String Spaces:
When displaying hexadecimal strings,
this value is the number of bytes used in a single group and after which a space
is inserted.
e.g. if the value is 1: 42 44 E0 F5 AA 00 00 BA, if the value is
4: 4244E0F5 AA0000BA.
•IP Address Mode: (available only when using the LoWPAN plugin)
When decoding 6LoWPAN messages, typically IP address will have the following format (hex):
FE80:0000:0000:0000:0280:1234:5678:0000 (16 byte address).
Displaying the full address consumes significant portion of the Message View window screen. When checking the IP Address Mode box, the analyzer will squeeze the IP addresses to the following format (for the above example):
FE80..0280:1234:5678:0
Were a single dot (.) represents word = 0, two dots (..) represent several consecutive words with value = 0, and zero word in the first or last word, is displayed as single zero (0).