Setting Time View related parameters:
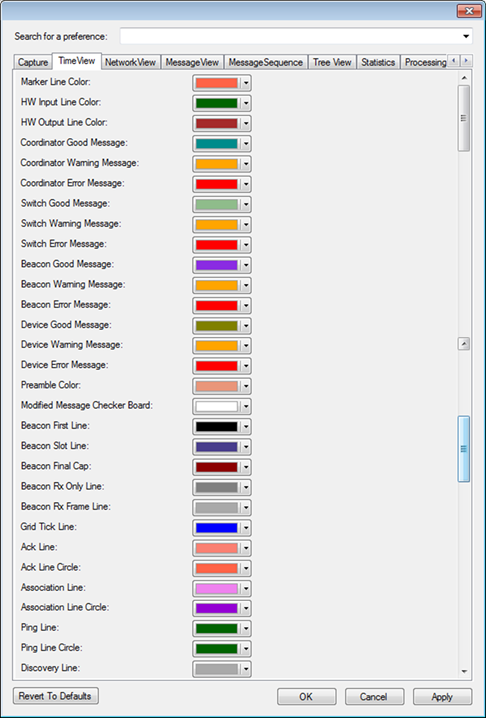
Figure 289 – Preferences, Time View tab – Top section
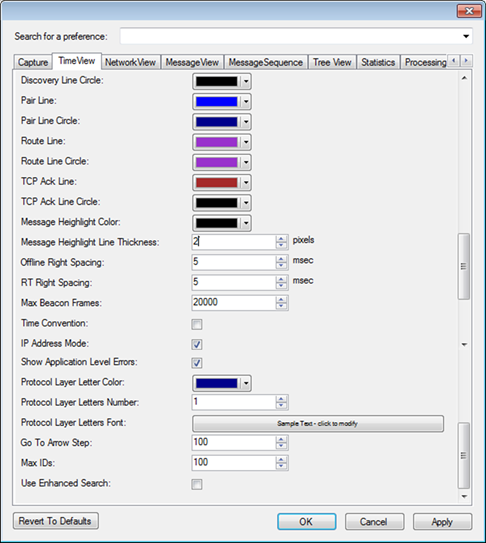
Figure 290 – Preferences, Time View tab – Bottom section
•Colors: (some fields appear only when using the LoWPAN plugin)
Allows setting the various colors
used in the Time View window (message color for a variety of source and message
types).
In addition it allows setting colors of beacon gridlines, Time View
grids, etc.
•Message Highlight Line Thickness:
Sets the thickness of the line
surrounding a message (used for marking the message when ‘Auto Sync’  from other windows is used).
•Offline Right Spacing:
Sets the time spacing between the last message and the Time View window ending border in Off-Line mode (used when analyzing a previously captured file). This 'spare' time holds no information and its aim is to facilitate the view of messages located close to the Time View window border.
•RT Right Spacing:
Sets the time spacing between the last message and the Time View window ending border in Real-Time Capture mode. This 'spare' time holds no information and its aim is to facilitate the view of messages located close to the Time View window border.
•Max Beacon Frames:
Maximal number of beacon frames that can be shown in Time View simultaneously.
•Time Convention:
Sets the way a time value is displayed in the Time View and Bookmarks and Notes windows. If checked, the time is displayed as hh:mm:ss.msec.. If not, it displays as xxxxx.yyy msec.
•IP Address Mode: (available only when using the LoWPAN plugin)
When decoding 6LoWPAN messages, the Time View vertical axis can be grouped by IP addresses (or IP address/Port).
Typically IP address will have the following format (hex):
FE80:0000:0000:0000:0280:1234:5678:0000 (16 byte address).
Displaying the full address consumes significant portion of the Time View window screen. When checking the IP Address Mode box, the analyzer will squeeze the IP addresses to the following format (for the above example):
FE80..0280:1234:5678:0
Were a single dot (.) represents word = 0, two dots (..) represent several consecutive words with value = 0, and zero word in the first or last word, is displayed as single zero (0).
•Show Application Level Errors:
If this box is checked, the analyzer will mark messages/fields with application errors or warnings with a surrounding red border line around them. If this box is not marked, only protocol problems will influence the message color settings.
•Protocol Layer Letter Color:
Sets the color of the letters to show as initials of the message layer initials. These letters will be displayed under the message body.
•Protocol Layer Letters Number:
Sets the number of letters to show as initials of the message layer text. These letters will be displayed under the message body.
•Protocol Layer Letters Font:
Sets the font size and type of the
letter initials from the message layer text that will be displayed below the
message body.
Note: Setting should be done for the smallest fonts.
Larger fonts (e.g. in case of zoom) are set automatically.
•Go To Arrow Step:
Pressing on the up or down arrows of
the 'GoTo' tool ( ) will add/subtract this step value from the
current message number in the Go To box. The messages found will be marked and
moved into a visible section of the different windows in the different
views.
) will add/subtract this step value from the
current message number in the Go To box. The messages found will be marked and
moved into a visible section of the different windows in the different
views.
•Max IDs:
Maximum number of y-axis entries in Time-View.
•Use Enhanced Search:
When selected directly open
the Enhanced Search form every time a search/find service is performed. If
unselected a search/find service will open the basic search form.
The
Enhanced Search option can be initiated from the basic search form.
Settings
of the "Always Open Enhanced Search" can be also modified in the Enhanced Search
form – see par.14.6.8).