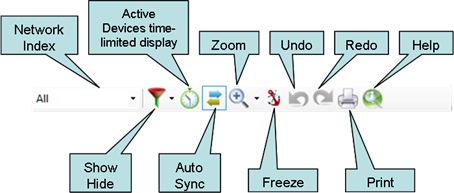
Figure 167 – Network View, Toolbar
Note: Due to
screen resolution and window size some of the icons may be hidden. In order to
see the hidden icons you should click on the icon list drop down menu  (this icon will appear on the right
handside of the menu in case of need).
(this icon will appear on the right
handside of the menu in case of need).
The Network View toolbar icons perform similar actions to those described within the Network View Top Menu option listed in paragraph 1.1.3.
The following paragraph provides a detailed description of those functions.
•Network index  – allows choosing which network is
displayed. The different Networks are identified by a specific number given by
the Perytons™ Protocol Analyzer based of the communication held between the
different devices received by it.(e.g. #1, #2, etc.). The number shown in
parenthesis near the Network identifier (e.g. '(9)'), indicates the number of
devices operating in the specific network.
– allows choosing which network is
displayed. The different Networks are identified by a specific number given by
the Perytons™ Protocol Analyzer based of the communication held between the
different devices received by it.(e.g. #1, #2, etc.). The number shown in
parenthesis near the Network identifier (e.g. '(9)'), indicates the number of
devices operating in the specific network.
The Network indicator 'All'
summarizes all networks together and the number in parenthesis is the total
number of devices being auto-discovered by the Perytons™ Protocol Analyzer.
•Show/Hide  – allows choosing which of the Network
View elements are displayed in the Network View window. For example when
analyzing routing data, the user may choose not to show the connections between
devices, etc. for a more comfortable and compact view:
– allows choosing which of the Network
View elements are displayed in the Network View window. For example when
analyzing routing data, the user may choose not to show the connections between
devices, etc. for a more comfortable and compact view:
Notes:
'Presume Devices' are
such devices that the analyzer deduced from indirect information received (such
as association tables) and concluded as an additional device. Such devices are
marked with a small question mark on top of them – see par. 6.4 and V.2.11 'Empty')).
If any of the elements is
hidden the icon's color will change 
•Active Devices time-limited display 


 - during real-time capture or playback
from an off-line file (simulation), the user can select whether to display all
devices (based on the different devices’ IDs included in the messages received
by the analyzer) or only such devices that have been active in a predefined time
window (active in the last 10 secs, 1 minute, 10 minutes, 30 minutes, 1 hour, 12
hours or 1 day). The current display status of devices will show when hovering
with the mouse over the relevant icon:
- during real-time capture or playback
from an off-line file (simulation), the user can select whether to display all
devices (based on the different devices’ IDs included in the messages received
by the analyzer) or only such devices that have been active in a predefined time
window (active in the last 10 secs, 1 minute, 10 minutes, 30 minutes, 1 hour, 12
hours or 1 day). The current display status of devices will show when hovering
with the mouse over the relevant icon: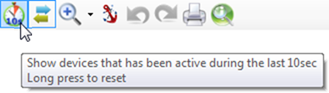
•Auto Sync  – allows to easily locating devices in
Network View as a result of their messages in other views of the Perytons™
Protocol Analyzer. If this option is chosen, clicking on a message in Time View,
Message View or on a device line in Devices or Message Sequence Views, will make
the originating device in Network View blink for easy identification.
– allows to easily locating devices in
Network View as a result of their messages in other views of the Perytons™
Protocol Analyzer. If this option is chosen, clicking on a message in Time View,
Message View or on a device line in Devices or Message Sequence Views, will make
the originating device in Network View blink for easy identification.
•Zoom  – set the Network View zoom. Clicking
on the icon itself returns zoom to its default position and sliding in the small
down arrow on the right allows setting the zoom manually
– set the Network View zoom. Clicking
on the icon itself returns zoom to its default position and sliding in the small
down arrow on the right allows setting the zoom manually

•Freeze  – stops the automatic device position
optimizer. Existing devices will not move during data capture (new devices will
be updated in Network View but their position in the window will not be
optimized)
– stops the automatic device position
optimizer. Existing devices will not move during data capture (new devices will
be updated in Network View but their position in the window will not be
optimized)
•Undo  – Devices can be manually dragged with
the mouse and located in different locations within the Network View window
(this is especially useful when using a graphic file as floor-plan or
background). Undo, cancels the last manual device repositioning
– Devices can be manually dragged with
the mouse and located in different locations within the Network View window
(this is especially useful when using a graphic file as floor-plan or
background). Undo, cancels the last manual device repositioning
•Redo  – redo the last manual device
repositioning (see 'Undo' explanation above)
– redo the last manual device
repositioning (see 'Undo' explanation above)
•Print  – prints the Network View
•Help  – opens the Network View on-line help on
the Perytons™ website (Internet connection is required)
– opens the Network View on-line help on
the Perytons™ website (Internet connection is required)