Setting capture related parameters:

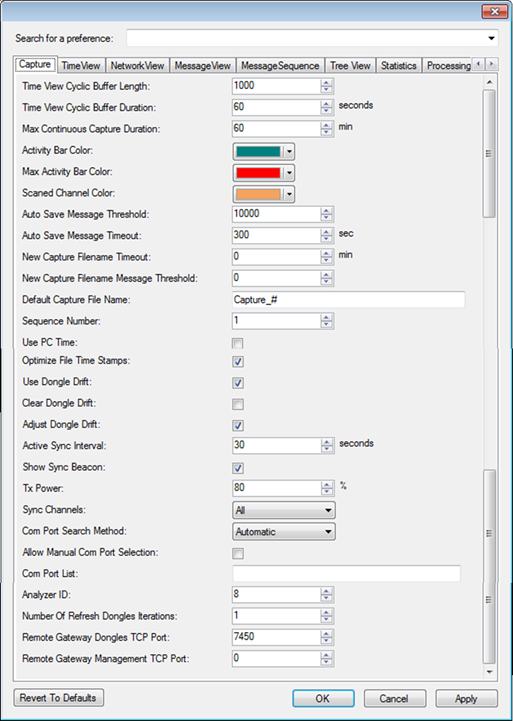
Figure 286 – Preferences, Capture tab
•Time View Cyclic Buffer Length:
Maximal number of messages that will
be displayed in Time View during continuous capture (real time or simulation
from file). When this number is exceeded, old messages are removed from the Time
View window (and also old bookmarks related to time sections that are no longer
relevant).
Note: All captured messages are kept in the data
capture file (.ANL).
If using a strong computer (fast processor and large RAM) this value can be set to 10,000 messages or more. In 'weaker' computers, Perytons suggests to keep this number under 2000 in order to avoid frustrating 'The System is Extremely Slow' type situations.
•Time View Cyclic Buffer Duration:
Maximal time that will be displayed in Time View during continuous capture (real time or simulation). When this number is exceeded, old messages are removed (and also old bookmarks related to time sections that are no longer relevant).
•Max Continuous Capture Duration:
Although Continuous data capture mode is not time limited (actually the factory limit set for this filed is one week = 10,080 minutes which is regarded as time unlimited), the user can set here a time limit for Continuous data capture mode. When this time is reached, data capture will stop even if set to continuous mode.
•Activity Bar, Max Activity Bar and Scanned Channel Colors:
Allows setting the various colors used in the capture form (RF activity bars, Scanned Channel, etc.).
•Auto Save Message Threshold:
In Continuous real time capture, this value sets the threshold to write messages to file. In the above example, every time the number of new messages captured exceeds 10,000, these messages will be appended to the output data (.ANL) file.
Note: Captured messages will be appended to the data file (.ANL), based on the 'Auto Save Message Threshold' or 'Auto Save Message Timeout' parameters, whichever is reached first.
•Auto Save Message Timeout:
Set the timeout in seconds after which the analyzer will save newly received messages into the output data (.ANL) file.
Note: Captured messages will be appended to the .ANL data file based on the 'Auto Save Message Threshold' or 'Auto Save Message Timeout' parameters, whichever is reached first.
•New Capture Filename Timeout:
When capturing data for very long
time periods, the Perytons™ Protocol Analyzer allows to automatically save the
data into separate files so file sizes are kept reasonable.
This value sets
the timeout in minutes after which the analyzer will save newly received
messages into a new data (.ANL) file.
When used in combination with the “New Capture Finename Message Threshold” value, the new capture file will be created as soon as either time or number of messages is reached, whichever comes first.
If set to 0, no new data file (.ANL) will be created after reaching this limit – i.e. there will possibly be a single data file (that can be sometimes relatively large).
•New Capture Filename Message Threshold:
When capturing data of a large amount of messages, the Perytons™ Protocol Analyzer allows to automatically save the data into separate files so file sizes are kept reasonable.
This value sets the number of captured messages after which the analyzer will save save the current capture file and open a new capture data file (.ANL) file.
When used in combination with the “New Capture Finename Timeout” value, the new capture file will be created as soon as either time or number of messages is reached, whichever comes first.
If set to 0, no new data file (.ANL) will be created after reaching this limit – i.e. there will possibly be a single data file (that can be sometimes relatively large).
•Default Capture File Name:
Name of the Data Capture file to use
as default. The '#' sign will be replaced by a count-up index that increases by
1 for each data capture file saved by the analyzer.
The starting index is set
by the 'Sequence Number' parameter.
•Sequence Number:
Initial index to use for data capture files
•Use PC Time:
If this option is selected, the dongle timestamp is ignored and overwritten by the PC time. This guarantees that all dongles will have a common time source, but adds jitter due to the PC operating system latency. This jitter is usually in the range of ~10msec (depending on the PC hardware and other applications running on the PC in parallel).
•Optimize File Time Stamps:
If this option in the Preferences is selected, when opening a long data (.ANL) file, the analyzer adjusts the dongle time drift according to PC time stamps in order to get better performance. In this case the results shown when opening a previously capture file may be a little different than the timing shown during file capture.
•Use Dongle Drift:
If this option in the Preferences is selected, in parallel to capturing data the analyzer will calibrate the dongles’ time drift according to the average PC clock. This calibration will be used in future captures and can therefore improve dongle timestamp accuracy.
•Clear Dongle Drift:
If this option in the Preferences form is selected, the dongles calibration data is cleared.
•Adjust Dongle Drift:
If this option in the Preferences form is selected then in case that during a long data capture process one of the channels has a high time drift (x10’s msecs), the analyzer will adjust the time of this message according to its PC time and the previously captured messages time base. These messages will be marked with a warning on the InfoStartTime field noting the level of adjustments that has been applied.
•Active Sync Interval:
For best time synchronization
between different channels, the Active Sync box of the Data Capture form should
be checked. In this mode, one of the dongles is used for time synchronization
and it transmits a specific message per channel every Active Sync Interval, as
set in the 'User Preferences' form (User/Preferences Capture tab). This message
is used to synchronize the receiving dongles resulting in a very accurate
timestamp set for the messages received in the different
channels.
Note: In this case one less channel can be captured (so 4
dongles will allow capturing of 3 channels). When Active Sync is chosen in the
Data Capture form, when having 4 USB dongles connected, the 'USB Dongles
Available' box will show '3+1'.
When in 'Active Sync' mode, the sync
message transmitted by the analyzer every few seconds needs to be taken into
account along with the system under test.
As a default the analyzer doesn't
show the Active Sync beacon messages. However, the user may want to see these
messages as part of the captured data in order to be able to analyze possible
interferences.
To do that, mark the ‘Show Sync Beacon:’ checkbox, see
next.
•Show Sync Beacon:
If marked, the analyzer will display the sync messages in the Time View window, and in the Network View (with the Perytons™ Logo indicating that the transmitting device is Perytons™). In any case all sync messages are kept in the capture file.
•Tx Power:
Value in the range of 0%-100% that allows setting the time sync messages transmission level. Usually the sync dongle is in near proximity to the Rx dongles and therefore a minimal Tx power is best to avoid saturation and decrease potential interference to the tested system. If the initial sync and on-going active sync does not work properly, the user may try to change this value to 50% or 100% and see if the problem is resolved.
This drop-down list allows the user to choose the channels that the analyzer will use in initial sync. Choosing ‘All’ will allow the analyzer to use any of the channels for sync. Using ‘RF4CE’ will allow the analyzer to use channels 15, 20 and 25. Choosing ‘NonRF4CE’ will allow the analyzer to use all channels except 15, 20 and 25. Choosing ‘None’ will disable the initial time sync process.

Figure 287 – Preferences, Capture tab, Sync Channels
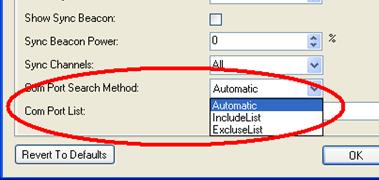
•COM Ports Search Method, Allow Manual Com Port Selection and COM Port List:
Here the user can set the way the analyzer detects dongles that are connected to the analyzer with COM over USB (in order for the user choice to take effect the ‘Allow Manual Com Port Selection’ option must be selected).

Figure 288 – Preferences, Capture tab, COM ports selection
Choosing ‘Automatic’ will let the
analyzer identify the dongles automatically. The analyzer will identify all COM
ports with the specific front-end/chip–set that was chosen for data capturing
and will send each of them a reset command. Only ports that replied to the reset
command with the expected messages will be used.
Note: In some
cases, non analyzer dongles of the same front-end/chip-set type that are
connected to the PC for non analyzer related purposes may have a problem with
this reset message.
Choosing ‘IncludeList’ will let the analyzer use only COM ports from the list defined in 'COM Port List' (e.g. 4, 3, 10, 12).
Choosing ‘ExcludeList’ will let the analyzer use all relevant COM ports except the ports listed in the COM Port List.
•Analyzer ID:
This value allows identifying
a Perytons™ Protocol Analyzer installation and is used in such scenarios when
several Perytons™ Protocol Analyzer applications are running in different
PCs.
Note: The Analyzer ID is specific for a specific PC and not
for various Perytons™ Protocol Analyzers instances running on a single
PC.
•Number Of Refresh Dongles Iterations:
This value allows running several 'Refresh Dongles' sessions for identifying the connected dongles.
•Remote Gateway Dongles TCP Port:
Port number that the remote connected gateway will use when connecting to the Perytons™ Protocol Analyzer (relevant only when a remote gateway is used for capturing 802.15.4 based data – see V.3.
•Remote Gateway Management TCP Port:
Port number that the remote connected gateway will use when connecting to the Perytons™ Protocol Analyzer (relevant only when a remote gateway is used for capturing 802.15.4 based data – see V.3.