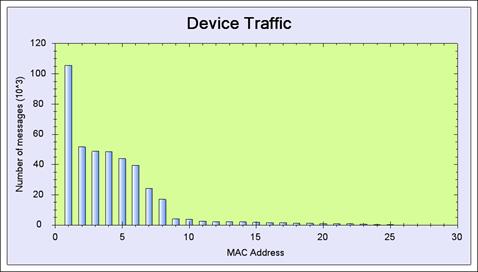
Scripts can build data into a statistics chart.
Charts are created and initiated in the Script constructor:
public DeviceTrafficHistogram(GraphBuilder builder)
: base(builder)
{
barGraph = new BarGraphData();// can also be
// PieGraphData
barGraph.Title = "Device Traffic";
barGraph.XLabel = "MAC Address";
barGraph.YLabel = "Number of messages";
barGraph.GraphType = GraphType.Bar;
builder.Add(barGraph);
}
GraphType
{
Bar,
XY
}
In the Script body, the data from a message is built into internal variables:
private class Device
{
public string Name;
public int Index;
public int NPackets;
public int NBytes;
}
public enum GraphX
{
values,
strings
}
SymbolsType
{
Square, Diamond, Triangle, Circle, XCross, Plus,
Star, TriangleDown, HDash, VDash, UserDefined,
Default, None
}
Dictionary<int, Device> devices =
new Dictionary<int, Device>();
BarGraphData barGraph;
public override void DoScript(Packet packet)
{
packet.AddToTimeView();
if (packet.Field("DeviceIndex").Exist)
{
int deviceIndex =
(int)packet.Field("DeviceIndex").Value;
string deviceName =
packet.Field("DeviceLongMAC").Meaning;
Device element;
if (devices.ContainsKey(deviceIndex))
{
element = devices[deviceIndex];
}
else
{
element = new Device();
element.Index = deviceIndex;
}
element.Name = deviceName;
element.NPackets++;
element.NBytes +=
(int)packet.Field("InfoMacLen").Value;
devices[deviceIndex] = element;
}
base.DoScript(packet);
}
and when the user opens the charts form, the Process function is called, building the data into the chart.
public override void Process()
{
// build chart
if (devices.Count > 0)
{
int nDevices = devices.Count;
string[] xStrings = new string[nDevices];
double[] values = new double[nDevices];
double[] values1 = new double[nDevices];
int index = 0;
foreach (KeyValuePair<int, Device> element in
devices)
{
xStrings[index] = element.Value.Name;
values[index] = (double)element.Value.NPackets;
values1[index] = (double)element.Value.NBytes;
index++;
}
//sort by value
for (int i = nDevices - 1; i > 0; i--)
{
for (int j = 0; j < i; j++)
{
if (values[j] < values[j + 1])
{
double tmpVal = values[j];
values[j] = values[j + 1];
values[j + 1] = tmpVal;
string tmpStr = xStrings[j];
xStrings[j] = xStrings[j + 1];
xStrings[j + 1] = tmpStr;
}
}
}
barGraph.X_strings = xStrings;
barGraph.ScalarValues = values;
base.Process();
}
}
The result of executing this Script is given in the following chart:

Figure 356 – Example Result of a Customized Statistic Graph defined by a Script
Example IV:
Following is another example for an 'Acknowledgements (acks) Latency Chart'. This Script looks for messages and their acks, measures the time that passed between a message received and its ack, builds the results into an histogram, and prints a message to the log for any 'ack latency' value that exceeds 11msec.
public class AckLatency : ScriptBase
{
// will hold a list of messages that expect ack
Dictionary<int, long> MessageTime =
new Dictionary<int, long>();
// ack time latency histogram
int AckMessageCount = 0;
double[] AckHistogram = new double[200];
BarGraphData barGraph;
// init chart properties
// (line thickness, symbol properties etc.)
public AckLatency(GraphBuilder builder)
: base(builder)
{
barGraph = new BarGraphData();
barGraph.Title = "Ack latency histogram";
barGraph.XLabel = "Time (msec)";
barGraph.YLabel = "% of messages";
barGraph.GraphType = GraphType.XY;
barGraph.Symbols = new SymbolType[] { SymbolType.None };
barGraph.LineThickness = new int[] { 2 };
builder.Add(barGraph);
}
// this method is called per every received message
public override void DoScript(Packet packet)
{
packet.AddToTimeView(); // add this message to time view
// this packet expects ack, and ack message was found
if (packet.Field("InfoRelatedMessagesAckAt").Exist
{
//add message to list
MessageTime[(int)packet.Field
("InfoRelatedMessagesAckAt").Value] = packet.Field("InfoStartTime").Value;
// add this message to time view, set color to Blue
packet.AddToTimeView(Color.Blue);
}
else
{
// this is an ack message
if (packet.Field("InfoRelatedMessagesAckTo").Exist)
{
// add this message to time view, set color to pink
packet.AddToTimeView(Color.Pink);
long time = packet.Field("InfoStartTime").Value;
// find original message in the list
if (MessageTime.ContainsKey(packet.Index))
{
double timeDiff = ((double)
(time - MessageTime[packet.Index])) /
1000;//msec
if ((timeDiff > 0) && (timeDiff < 20))
{
AckHistogram[(int)(timeDiff * 10)]++;
AckMessageCount++;
}
if (timeDiff > 11) // more than 11msec
{
// add this message to message view
packet.AddToMessageView();
// issue an event, severity "info"
Loggers.EventsLogger.Info("Long ack latency, Message#"
+ packet.Index + " " + timeDiff + "msec");
}
}
}
}
base.DoScript(packet);
}
// this is called when statistics charts are built
public override void Process()
{
// build chart
if (AckMessageCount > 0)
{
double[] xValues = new double[200];
double[] values = new double[200];
for (int i = 0; i < 200; i++)
{
xValues[i] = (double)i / 10.0;
values[i] = 100.0 * AckHistogram[i] /
AckMessageCount;
}
// build chart
barGraph.X_values = xValues;
barGraph.ScalarValues = values;
}
base.Process();
}
The result of this Script is shown in the following images:
In Time View:
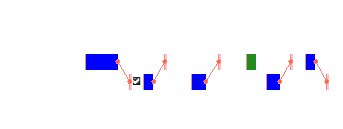
Figure 357 – Example result of a Time view related Script
In Message View:
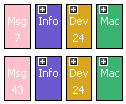
Figure 358 – Example result of a Message View related Script
The 'Acknowledgement Latency' chart:
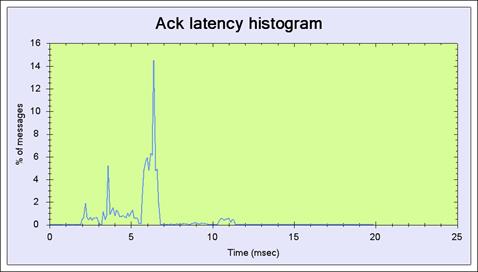
Figure 359 – Example - The Ack. Latency Histogram Chart Script
In the Events Log window:
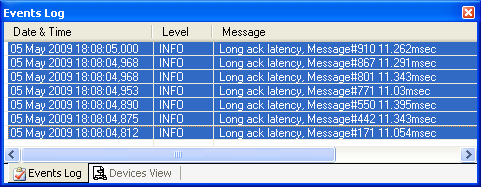
Figure 360 – Example result of an Events Log related Script
Example V:
In the following example, the Script attaches a user defined note to specific messages and to a specific device and builds a Pie Chart showing the amount of broadcasted messages in the Network Layer out of the full amount of messages received:
public class BroadcastCnt : ScriptBase
{
// global Script variables here
private int nBroadcast;
private int nOthers;
private PieGraphData pieBrdcst;
// init chart properties
public BroadcastCnt(GraphBuilder builder)
: base(builder)
{
pieBrdcst = new PieGraphData();
pieBrdcst.Title = "Number of Broadcasted Messages in NWL";
pieBrdcst.Legend = new String[]{"Broadcast", "Non-Broadcast"};
builder.Add(pieBrdcst);
}
// this method is called per every received message
public override void DoScript(Packet packet)
{
packet.AddToTimeView();
if(packet.Field("NwlHeaderDestAddress").Value == 0xFFFF)
{
packet.AddToTimeView(Color.Blue);
packet.AddMessageNote("Network Layer Broadcast-Message, Message#" + packet.Index);
packet.AddToMessageView();
nBroadcast++;
}
else
{
nOthers++;
}
base.DoScript(packet);
}
// this is called when statistics charts are built
public override void Process() // don't remove this line
{
// Do your summary code here
if (nBroadcast + nOthers > 0);
{
pieBrdcst.Values = new double []{(double)nBroadcast,(double)nOthers};
}
base.Process();
}
// This method is called for each device before it needs to be drawn in the network view.
public override IconGroup GetDeviceIcon(NetworkViewDevice device)
{
if (device.DeviceInfo.short_mac_address == 0x504B)
{
device.AddNote("This is the New Shade device from Orgon. Need to re-test their new FW");
}
return null;
}
A resulting screenshot after executing this Script follows:
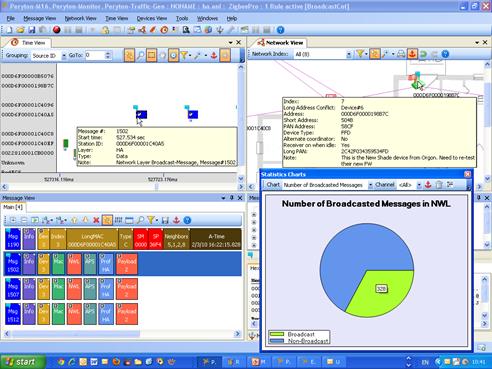
Figure 361 – Example - The BroadCast Count and Notes Script